
Dashboard
The Dashboard is your performance overview. Open Apps → BundleWise, it is the default home screen.
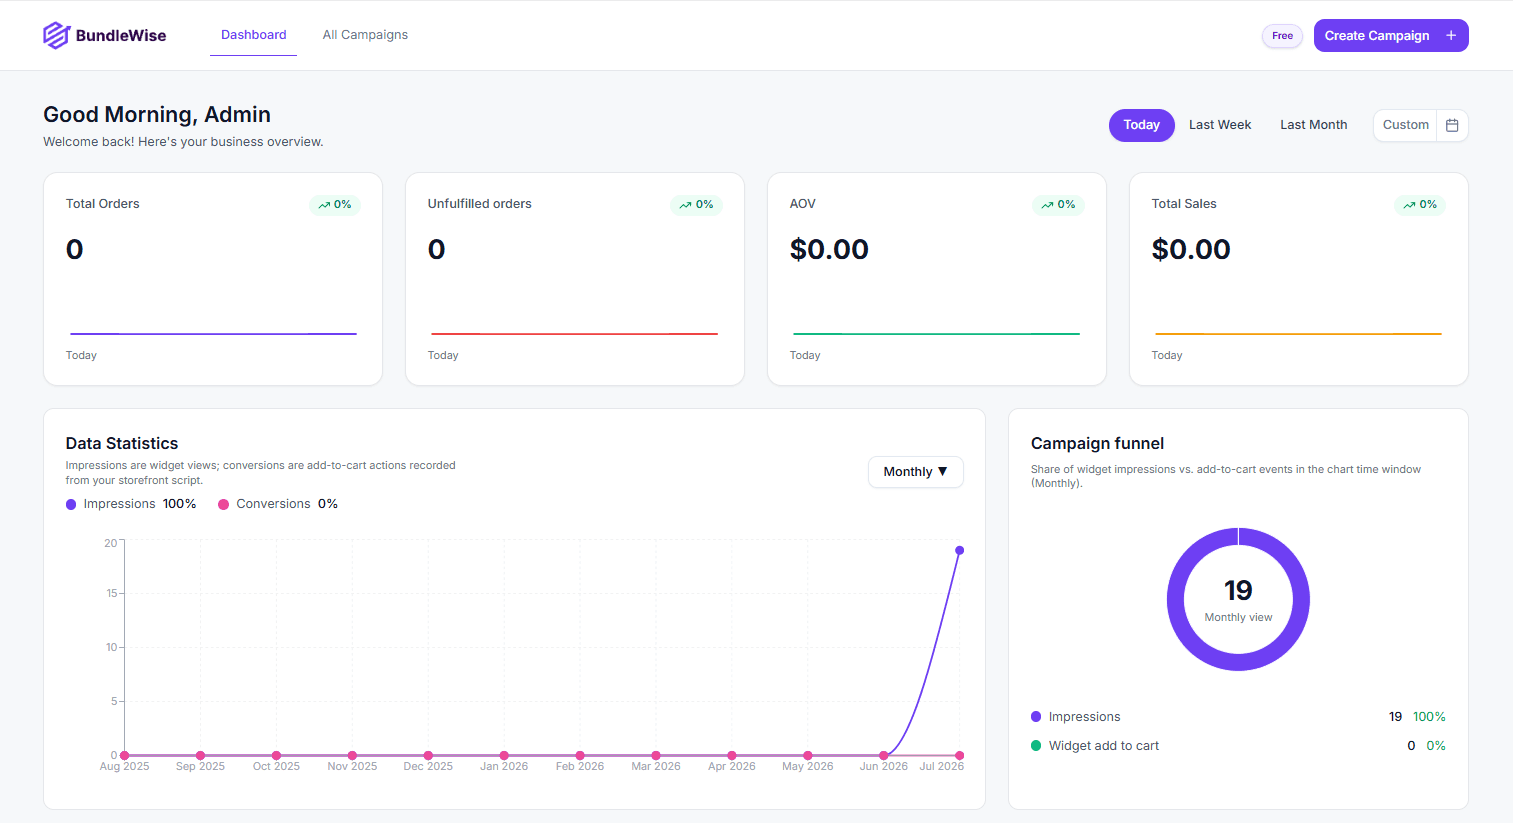
Date range
Use the buttons at the top:
- Today
- Last Week
- Last Month
- Custom range, pick start and end dates on the calendar (future dates are disabled)
Stats cards and charts update for the range you select.
Overview cards
Four summary cards for the selected period (from Shopify order data):
| Card | What it shows |
|---|---|
| Total Orders | Paid orders in the range |
| Unfulfilled orders | Orders not yet fulfilled |
| AOV | Average order value |
| Total Sales | Total sales in the range |
Each card includes a trend percentage, sparkline, and period label.
Charts
- Data Statistics, impressions vs conversions over time. Use the chart dropdown to switch granularity: Daily, Weekly, Monthly, or Yearly (independent of the header date range). Impressions are widget views; conversions are add-to-cart actions from your storefront script.
- Campaign funnel, share of impressions vs add-to-cart in the chart window.
On very high-volume stores, some Shopify totals may use a sample of recent paid orders (up to about 1,250 per range) so the dashboard stays fast, numbers can be slightly lower than full admin reports.
Best campaigns & top products
- Best Performing Campaigns, ranked by widget add-to-cart activity. Revenue per row may show — when per-campaign revenue is not attributed yet.
- Top products, products driving activity in the selected window.
Click See all Campaigns to open the full list and edit any campaign.